Datei:Correlation examples.png
Originaldatei(824 × 346 Pixel, Dateigröße: 15 KB, MIME-Typ: image/png)

Diese Datei und die Informationen unter dem roten Trennstrich werden aus dem zentralen Medienarchiv Wikimedia Commons eingebunden.

Zur Beschreibungsseite auf Commons


BeschreibungSee below.
Datum8. Dezember 2007 (Original-Hochladedatum)
QuelleÜbertragen aus en.wikipedia nach Commons durch jtneill.
Dieses Diagramm wurde mit Mathematica erstellt.
UrheberImagecreator in der Wikipedia auf Englisch
Andere VersionenFile:CovrarianceCorrelation.svg, File:Correlation examples2.svg
[[:File:CovrarianceCorrelaخنtion.svg]] ist eine vektorisierte Version dieses Bildes.

Fehler: Ein SVG-Bild dieses Namens gibt es nicht. Bitte verwende das richtige Format: {{Vector version available|Dateiname}}.


File:Correlation examples.png → [[:File:CovrarianceCorrelaخنtion.svg]]

Für weitere Informationen siehe Help:SVG.

In anderen Sprachen
Alemannisch Bahasa Indonesia Bahasa Melayu British English català čeština dansk Deutsch eesti English español Esperanto euskara français Frysk galego hrvatski Ido italiano lietuvių magyar Nederlands norsk bokmål norsk nynorsk occitan Plattdüütsch polski português português do Brasil română Scots sicilianu slovenčina slovenščina suomi svenska Tiếng Việt Türkçe vèneto Ελληνικά беларуская (тарашкевіца) български македонски нохчийн русский српски / srpski татарча/tatarça українська ქართული հայերեն বাংলা தமிழ் മലയാളം ไทย 한국어 日本語 简体中文 繁體中文 עברית العربية فارسی +/−
[[File:CovrarianceCorrelaخنtion.svg|Neue Vektorgrafik|150x150px]]

Beschreibung

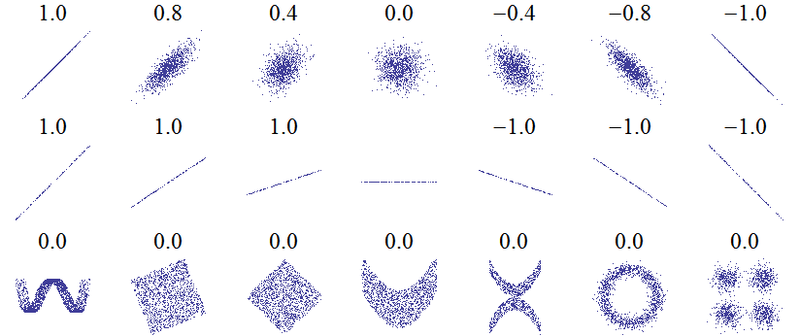
An example of the correlation of x and y for various distributions of (x,y) pairs. It was created by this Mathematica 6 code, which I wrote and release into the public domain (needs makePlot!):

n = 2000;GraphicsArray[{  Table[makePlot[    Table[{RandomReal[NormalDistribution[0, 1]], (1 - Abs[w])*        RandomReal[NormalDistribution[0, 1]]} .       RotationMatrix[-Sign[w]*Pi/4], {i, -1, 1, 2./n}], 1000], {w,     1, -1, -1/3}],  Table[makePlot[Table[{x, slope*x}, {x, -1, 1, 2./n}], 100], {slope,     1, -1, -1/3}],  {   makePlot[    Table[{x + RandomReal[]/3,       4 (x^2 - 1/2)^2 + RandomReal[]/500} , {x, -1, 1, 2./n}], 2000],   makePlot[    Table[{RandomReal[{-1, 1}], RandomReal[{-1, 1}]} .       RotationMatrix[-Pi/8], {x, -1, 1, 2./n}], 1400],   makePlot[    Table[{RandomReal[{-1, 1}], RandomReal[{-1, 1}]} .       RotationMatrix[-Pi/4], {x, -1, 1, 2./n}], 1400],   makePlot[Table[{x, x^2 + RandomReal[]}/2, {x, -1, 1, 2./n}],     1400],   makePlot[    Table[{x, x^2 + RandomReal[]/2}*(RandomInteger[1]*2 - 1), {x, -1,       1, 2./n}], 1000],   makePlot[    Table[{Sin[x*Pi] + RandomReal[NormalDistribution[0, 1/8]],       Cos[x*Pi] + RandomReal[NormalDistribution[0, 1/8]]}, {x, -1, 1,       2./n}], 1400],   makePlot[    Table[{RandomReal[NormalDistribution[0, 1/3]],        RandomReal[        NormalDistribution[0, 1/3]]} + {RandomInteger[1]*2 - 1,        RandomInteger[1]*2 - 1}, {x, -1, 1, 2./n}], 1400]   }  }]

Lizenz

Public domainDieses Werk wurde von seinem Urheber Imagecreator in der Wikipedia auf Englisch als gemeinfrei veröffentlicht. Dies gilt weltweit.
In manchen Staaten könnte dies rechtlich nicht möglich sein. Sofern dies der Fall ist:
Imagecreator gewährt jedem das bedingungslose Recht, dieses Werk für jedweden Zweck zu nutzen, es sei denn, Bedingungen sind gesetzlich erforderlich.

Ursprüngliches Datei-Logbuch

Die ursprüngliche Dateibeschreibungsseite war hier. Alle folgenden Benutzernamen beziehen sich auf en.wikipedia.
  • 2007-12-08 19:16 Imagecreator 824×346×8 (20371 bytes) == Summary == An example of the correlation of x and y for various distributions of (x,y) pairs. It was created by this Mathematica 6 code, which I wrote and release into the public domain: <pre> (*Several sets of (x,y) points, with the correlation coef
  • 2007-12-08 18:48 Imagecreator 824×346×8 (21374 bytes) An example of the correlation of x and y for various distributions of (x,y) pairs. It was created by this Mathematica 6 code, which I wrote and release into the public domain: (*Several sets of (x,y) points, with the correlation coefficient of x \ and y

Kurzbeschreibungen

Ergänze eine einzeilige Erklärung, was diese Datei darstellt.

In dieser Datei abgebildete Objekte

Motiv

image/png

bb8ddae02ac1df1c7577cdca1325347c11ecac3b

15.745 Byte

346 Pixel

824 Pixel

Dateiversionen

Klicke auf einen Zeitpunkt, um diese Version zu laden.

Version vomVorschaubildMaßeBenutzerKommentar
aktuell11:33, 2. Feb. 2010Vorschaubild der Version vom 11:33, 2. Feb. 2010824 × 346 (15 KB)JBWRemoving "0.0" for correlation coefficient from horizontal line: here corr. coeff. is undefined.
12:27, 18. Mär. 2008Vorschaubild der Version vom 12:27, 18. Mär. 2008824 × 346 (20 KB)Jtneill{{Information |Description={{en|An example of the correlation of x and y for various distributions of (x,y) pairs. It was created by this Mathematica 6 code, which I wrote and release into the public domain: n = 2000; GraphicsArray[{ Table[makePlot[

Die folgende Seite verwendet diese Datei:

Globale Dateiverwendung