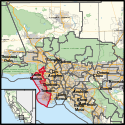
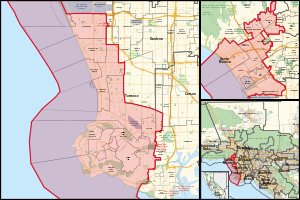
California's 36th congressional district is a U.S. congressional district in California. The 36th district is located primarily in the South Bay and Westside regions of Los Angeles. It takes in the cities of Beverly Hills, Santa Monica,the west side of Culver City, Hermosa Beach, Rancho Palos Verdes, Redondo Beach, Palos Verdes Estates, Rolling Hills Estates, El Segundo, Lomita, Manhattan Beach, and the west side of Torrance, as well as the Los Angeles neighborhoods of Venice, Playa del Rey, Palms, Cheviot Hills, Westwood Village, West Los Angeles, Mar Vista, Westchester, Marina Peninsula, and west side Harbor City.
| California's 36th congressional district | |||
|---|---|---|---|
Interactive map of district boundaries since January 3, 2023 | |||
| Representative |
| ||
| Area | 480 sq mi (1,200 km2) | ||
| Population (2022) | 727,412 | ||
| Median household income | $121,164[1] | ||
| Ethnicity |
| ||
| Cook PVI | D+21[2] | ||
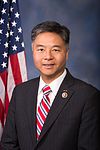
The district is represented by Democrat Ted Lieu.
Recent results in statewide elections
editComposition
edit| # | County | Seat | Population |
|---|---|---|---|
| 37 | Los Angeles | Los Angeles | 9,829,544 |
Los Angeles County is split between this district, the 32nd district, the 30th district, the 37th district, the 43rd district, and the 44th district. The 36th and 32nd are partitioned by Adelaide Dr, 602 Kingman Dr-800 Woodacres Rd, The Riviera Country Club, 26th St, Montana Ave, S Bristol Ave, Wellesley Ave/Centinela Ave, 1009 Centinela Ave/1165Centinela Ave, Highway 2, Butler Ave, Purdue Ave, Cotner Ave, Pontius Ave, Santa Monica Blvd, Glendon Ave, Malcolm Ave, Wilshire Blvd, Veteran Ave, W Sunset Blvd, Tower Rd, Franklin Canyon Reservoir, Lago Vista Dr, Monte Cielo Dr, 1280 Coldwater Canyon Dr-1210 Coldwater Canyon Dr, Greystone Park, Ridgecrest Dr, Schuyler Rd, Cherokee Ln, Loma Vista Dr, 400 N Evelyn Pl-1966 Carla Ridge, Ridgemont Dr, Crescent Dr, 410 Martin Ln-1016 N Hillcrest Rd, Sierra Mar Dr, and La Collin Dr.
The 36th, 30th and 37th are partitioned by Phyllis Ave, N Doheny Dr, N Oakhurst Dr, Burton Way, N Robertson Blvd, 8733 Clifton Way-201 S Le Doux Rd, N San Vicente Blvd, La Cienga Park, S Le Doux Rd, Gregory Way, S Robertson Blvd, Whitworth Dr, Beverly Green Dr, 1271 Beverly Green Dr-1333 Beverly Green Dr, Heath Ave, S Moreno Dr, Highway 2, Century Park W, W Pico Blvd, Patricia Ave, Lorenzo Pl, Monte Mar Dr, Beverwill Dr, Castle Heights Ave, Club Dr, McConnell Dr, National Blvd, Palms Blvd, Overland Ave, Venice Blvd, Highway 405, W Havelock Ave, S St Nicholas Ave, Ballona Creek, and Centinela Creek Channel.
The 36th, 43rd and 44th are partitioned by W Florence Ave, Arbor Vitae St, Westchester Parkway, La Tijera Blvd, W 91st St, Cum Laude Ave, W 92nd St, Waterview St, Napoleon St, Vista Del Mar, W Imperial Highway, Aviation Blvd, Del Aire Park, E Sl Segundo Blvd, S Aviation Blvd, Marine Ave, Inglewood Ave, Highway 91, Redondo Beach Blvd, Hawthorne Blvd, Sepulveda Blvd, Normandie Ave, Frampton Ave, 253rd St, 255th St, Belle Porte Ave, 256th St, 1720 256th St-1733 256th St, 1701 257th St-1733 257th St, 1734 257th St-W 262nd St, Ozone Ave, 263rd St, 26302 Alta Vista Ave-26356 Alta Vista Ave, Pineknoll Ave, Leesdale Ave, Highway 213, Palos Verde Dr N, 26613 Leesdale Ave-Navy Field, S Western Ave, Westmont Dr, Eastview Park, Mt Rose Rd/Amelia Ave, 1102 W Bloomwood Rd-1514 Caddington Dr, N Western Ave, W Summerland St, N Enrose Ave/Miraleste Dr, Miraleste Dr, and the Martin J. Bogdanovich Recreation Center and Park.
Cities & CDP with 10,000 or more people
edit- Los Angeles - 3,898,747
- Santa Monica - 93,076
- Redondo Beach - 71,576
- Rancho Palos Verdes - 42,287
- Manhattan Beach - 35,506
- Beverly Hills - 32,701
- Lomita - 20,921
- Hermosa Beach - 19,728
- El Segundo - 17,272
- Palos Verdes Estates - 13,347
2,500-10,000 people
edit- Rolling Hills Estates - 8,280
List of members representing the district
editElection results
edit1962 • 1964 • 1966 • 1968 • 1970 • 1972 • 1974 • 1976 • 1978 • 1980 • 1982 • 1984 • 1986 • 1988 • 1990 • 1992 • 1994 • 1996 • 1998 • 2000 • 2002 • 2004 • 2006 • 2008 • 2010 • 2011 (Special) • 2012 • 2014 • 2016 • 2018 • 2020 • 2022 |
1962
edit| Party | Candidate | Votes | % | |
|---|---|---|---|---|
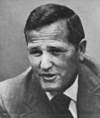
| Republican | Bob Wilson (Incumbent) | 91,626 | 61.8 | |
| Democratic | William C. Godfrey | 56,637 | 38.2 | |
| Total votes | 148,263 | 100.0 | ||
| Republican hold | ||||
1964
edit| Party | Candidate | Votes | % | |
|---|---|---|---|---|
| Republican | Bob Wilson (Incumbent) | 105,346 | 59.1 | |
| Democratic | Quintin Whelan | 73,034 | 40.9 | |
| Total votes | 178,380 | 100.0 | ||
| Republican hold | ||||
1966
edit| Party | Candidate | Votes | % | |
|---|---|---|---|---|
| Republican | Bob Wilson (Incumbent) | 119,274 | 72.9 | |
| Democratic | Don Lindgren | 44,365 | 27.1 | |
| Total votes | 163,639 | 100.0 | ||
| Republican hold | ||||
1968
edit| Party | Candidate | Votes | % | |
|---|---|---|---|---|
| Republican | Bob Wilson (Incumbent) | 147,772 | 71.6 | |
| Democratic | Don Lindgren | 58,578 | 28.4 | |
| Total votes | 206,350 | 100.0 | ||
| Republican hold | ||||
1970
edit| Party | Candidate | Votes | % | |
|---|---|---|---|---|
| Republican | Bob Wilson (Incumbent) | 132,446 | 71.5 | |
| Democratic | Daniel K. Hostetter | 44,841 | 24.2 | |
| Peace and Freedom | Walter H. Koppelman | 5,139 | 2.8 | |
| American Independent | Orville J. Davis | 2,723 | 1.5 | |
| Total votes | 185,149 | 100.0 | ||
| Republican hold | ||||
1972
edit| Party | Candidate | Votes | % | |
|---|---|---|---|---|
| Republican | William M. Ketchum | 87,984 | 52.7 | |
| Democratic | Timothy Lemucchi | 72,516 | 43.5 | |
| American Independent | William M. "Bill" Armour | 6,307 | 3.8 | |
| Total votes | 166,807 | 100.0 | ||
| Republican hold | ||||
1974
edit| Party | Candidate | Votes | % | |
|---|---|---|---|---|
| Democratic | George Brown Jr. (Incumbent) | 69,615 | 62.6 | |
| Republican | Jim Osgood | 35,858 | 32.3 | |
| American Independent | William E. Pasley | 5,701 | 5.1 | |
| Total votes | 111,174 | 100.0 | ||
| Democratic hold | ||||
1976
edit| Party | Candidate | Votes | % | |
|---|---|---|---|---|
| Democratic | George Brown Jr. (Incumbent) | 90,830 | 61.5 | |
| Republican | Grant Carner | 49,368 | 33.5 | |
| American Independent | William E. Pasley | 7,358 | 5.0 | |
| Total votes | 147,556 | 100.0 | ||
| Democratic hold | ||||
1978
edit| Party | Candidate | Votes | % | |
|---|---|---|---|---|
| Democratic | George Brown Jr. (Incumbent) | 80,448 | 62.9 | |
| Republican | Dana Warren Carmody | 47,417 | 37.1 | |
| Total votes | 127,865 | 100.0 | ||
| Democratic hold | ||||
1980
edit| Party | Candidate | Votes | % | |
|---|---|---|---|---|
| Democratic | George Brown Jr. (Incumbent) | 88,628 | 52.6 | |
| Republican | John Paul Stark | 73,247 | 43.4 | |
| Libertarian | Harry J. Histen | 6,815 | 4.0 | |
| Total votes | 168,690 | 100.0 | ||
| Democratic hold | ||||
1982
edit| Party | Candidate | Votes | % | |
|---|---|---|---|---|
| Democratic | George Brown Jr. (Incumbent) | 76,546 | 54.3 | |
| Republican | John Paul Stark | 64,361 | 45.7 | |
| Total votes | 140,907 | 100.0 | ||
| Democratic hold | ||||
1984
edit| Party | Candidate | Votes | % | |
|---|---|---|---|---|
| Democratic | George Brown Jr. (Incumbent) | 104,438 | 56.6 | |
| Republican | John Paul Stark | 80,212 | 43.4 | |
| Total votes | 184,650 | 100.0 | ||
| Democratic hold | ||||
1986
edit| Party | Candidate | Votes | % | |
|---|---|---|---|---|
| Democratic | George Brown Jr. (Incumbent) | 78,118 | 57.1 | |
| Republican | Robert L. "Bob" Henley | 58,660 | 42.9 | |
| Total votes | 136,778 | 100.0 | ||
| Democratic hold | ||||
1988
edit| Party | Candidate | Votes | % | |
|---|---|---|---|---|
| Democratic | George Brown Jr. (Incumbent) | 103,493 | 54.0 | |
| Republican | John Paul Stark | 81,413 | 42.4 | |
| Libertarian | Kenneth E. Valentine | 3,382 | 1.8 | |
| American Independent | Fred L. Anderson | 3,360 | 1.8 | |
| Total votes | 191,648 | 100.0 | ||
| Democratic hold | ||||
1990
edit| Party | Candidate | Votes | % | |
|---|---|---|---|---|
| Democratic | George Brown Jr. (Incumbent) | 72,409 | 52.7 | |
| Republican | Bob Hammock | 64,961 | 47.3 | |
| Total votes | 137,370 | 100.0 | ||
| Democratic hold | ||||
1992
edit| Party | Candidate | Votes | % | |
|---|---|---|---|---|
| Democratic | Jane Harman | 125,751 | 48.4 | |
| Republican | Joan Milke Flores | 109,684 | 42.3 | |
| Green | Richard Greene | 13,297 | 5.1 | |
| Peace and Freedom | Owen Stanley | 5,519 | 2.1 | |
| Libertarian | Marc F. Denny | 5,504 | 2.1 | |
| Independent | Larry Martz (write-in) | 2 | 0.0 | |
| Total votes | 259,757 | 100.0 | ||
| Democratic hold | ||||
1994
edit| Party | Candidate | Votes | % | |
|---|---|---|---|---|
| Democratic | Jane Harman (Incumbent) | 93,939 | 48.0 | |
| Republican | Susan Brooks | 93,127 | 47.6 | |
| Libertarian | Jack Tyler | 4,932 | 2.5 | |
| American Independent | Joseph J. "Joe" Fields | 3,810 | 1.9 | |
| Total votes | 195,808 | 100.0 | ||
| Democratic hold | ||||
1996
edit| Party | Candidate | Votes | % | |
|---|---|---|---|---|
| Democratic | Jane Harman (Incumbent) | 117,752 | 52.5 | |
| Republican | Susan Brooks | 98,538 | 44.0 | |
| Libertarian | Bruce Dovner | 4,933 | 2.1 | |
| Natural Law | Bradley McManus | 3,236 | 1.4 | |
| Total votes | 224,459 | 100.0 | ||
| Democratic hold | ||||
1998
edit| Party | Candidate | Votes | % | |||
|---|---|---|---|---|---|---|
| Republican | Steven T. Kuykendall | 88,843 | 48.9 | |||
| Democratic | Janice Hahn | 84,624 | 46.6 | |||
| Green | Robin Barrett | 3,612 | 2.0 | |||
| Libertarian | Kerry Welsh | 3,066 | 1.7 | |||
| Reform | John R. Konopka | 1,561 | 0.8 | |||
| Total votes | 181,706 | 100.0 | ||||
| Republican gain from Democratic | ||||||
2000
edit| Party | Candidate | Votes | % | |||
|---|---|---|---|---|---|---|
| Democratic | Jane Harman | 115,651 | 48.4 | |||
| Republican | Steven T. Kuykendall (Incumbent) | 111,199 | 46.6 | |||
| Libertarian | Daniel R. Sherman | 6,073 | 2.6 | |||
| Reform | John R. Konopka | 3,549 | 1.4 | |||
| Natural Law | Matt Ornati | 2,264 | 0.9 | |||
| Republican | William D. Davies (write-in) | 395 | 0.1 | |||
| Total votes | 239,131 | 100% | ||||
| Democratic gain from Republican | ||||||
2002
edit| Party | Candidate | Votes | % | |
|---|---|---|---|---|
| Democratic | Jane Harman (Incumbent) | 88,198 | 61.4 | |
| Republican | Stuart Johnson | 50,328 | 35.0 | |
| Libertarian | Mark McSpadden | 5,225 | 3.6 | |
| Total votes | 143,751 | 100.0 | ||
| Democratic hold | ||||
2004
edit| Party | Candidate | Votes | % | |
|---|---|---|---|---|
| Democratic | Jane Harman (Incumbent) | 151,208 | 62.0 | |
| Republican | Paul Whitehead | 81,666 | 33.5 | |
| Peace and Freedom | Alice Stek | 6,105 | 2.5 | |
| Libertarian | Mike Binkley | 5,065 | 2.0 | |
| Total votes | 244,144 | 100.0 | ||
| Democratic hold | ||||
2006
edit| Party | Candidate | Votes | % | |
|---|---|---|---|---|
| Democratic | Jane Harman (Incumbent) | 105,323 | 63.4 | |
| Republican | Brian Gibson | 53,068 | 32.0 | |
| Peace and Freedom | James R. Smith | 4,592 | 2.7 | |
| Libertarian | Mike Binkley | 3,170 | 1.9 | |
| Total votes | 166,153 | 100.0 | ||
| Democratic hold | ||||
2008
edit| Party | Candidate | Votes | % | |
|---|---|---|---|---|
| Democratic | Jane Harman (Incumbent) | 171,948 | 68.7 | |
| Republican | Brian Gibson | 78,543 | 31.3 | |
| Total votes | 250,491 | 100.0 | ||
| Democratic hold | ||||
2010
edit| Party | Candidate | Votes | % | |
|---|---|---|---|---|
| Democratic | Jane Harman (Incumbent) | 114,489 | 59.7 | |
| Republican | Mattie Fein | 66,706 | 34.7 | |
| Libertarian | Herb Peters | 10,840 | 5.6 | |
| Total votes | 192,035 | 100.0 | ||
| Democratic hold | ||||
2011 (Special)
edit| Party | Candidate | Votes | % | |
|---|---|---|---|---|
| Democratic | Janice Hahn | 47,000 | 54.9 | |
| Republican | Craig Huey | 38,624 | 45.1 | |
| Total votes | 85,624 | 100.0 | ||
| Turnout | 25.0 | |||
| Democratic hold | ||||
2012
edit| Party | Candidate | Votes | % | |
|---|---|---|---|---|
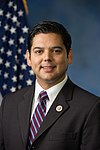
| Democratic | Raul Ruiz | 110,189 | 52.9 | |
| Republican | Mary Bono (Incumbent) | 97,953 | 47.1 | |
| Total votes | 208,142 | 100.0 | ||
| Democratic gain from Republican | ||||
2014
edit| Party | Candidate | Votes | % | |
|---|---|---|---|---|
| Democratic | Raul Ruiz (Incumbent) | 72,682 | 54.2 | |
| Republican | Brian Nestande | 61,457 | 45.8 | |
| Total votes | 134,139 | 100.0 | ||
| Democratic hold | ||||
2016
edit| Party | Candidate | Votes | % | |
|---|---|---|---|---|
| Democratic | Raul Ruiz (Incumbent) | 144,348 | 62.1 | |
| Republican | Jeff Stone | 88,269 | 37.9 | |
| Total votes | 232,617 | 100.0 | ||
| Democratic hold | ||||
2018
edit| Party | Candidate | Votes | % | |
|---|---|---|---|---|
| Democratic | Raul Ruiz (Incumbent) | 122,169 | 59.0 | |
| Republican | Kimberlin Brown Pelzer | 84,839 | 41.0 | |
| Total votes | 207,008 | 100.0 | ||
| Democratic hold | ||||
2020
edit| Party | Candidate | Votes | % | |
|---|---|---|---|---|
| Democratic | Raul Ruiz (Incumbent) | 185,151 | 60.3 | |
| Republican | Erin Cruz | 121,698 | 39.7 | |
| Total votes | 306,849 | 100.0 | ||
| Democratic hold | ||||
2022
edit| Party | Candidate | Votes | % | |
|---|---|---|---|---|
| Democratic | Ted Lieu (Incumbent) | 194,299 | 69.8 | |
| Republican | Joe Collins III | 84,264 | 30.2 | |
| Total votes | 278,563 | 100.0 | ||
| Democratic hold | ||||
Historical district boundaries
editFrom 1993 to 2013, the 36th was located in southwestern Los Angeles County and included Manhattan Beach, Hermosa Beach, Torrance, Redondo Beach, and portions of Los Angeles itself. This district was largely dismantled after the 2010 census, and moved east to Riverside County and includes Palm Springs and La Quinta. The current 36th is largely the successor of the old 45th district.
See also
editReferences
edit- ^ US Census
- ^ "2022 Cook PVI: District Map and List". Cook Political Report. July 12, 2022. Retrieved January 10, 2023.
- ^ Statement of Vote (1990 Governor)
- ^ Statement of Vote (1992 President)
- ^ Statement of Vote (1992 Senate)
- ^ Statement of Vote (1992 Senate)
- ^ Statement of Vote (1994 Governor)
- ^ Statement of Vote (1994 Senate)
- ^ Statement of Vote (1996 President)
- ^ Statement of Vote (1998 Governor) Archived September 29, 2011, at the Wayback Machine
- ^ Statement of Vote (1998 Senate) Archived September 29, 2011, at the Wayback Machine
- ^ Statement of Vote (2000 President)
- ^ Statement of Vote (2000 Senator)
- ^ Statement of Vote (2002 Governor)
- ^ Statement of Vote (2003 Recall Question)
- ^ Statement of Vote (2003 Governor)
- ^ Statement of Vote (2004 President)
- ^ Statement of Vote (2004 Senator)
- ^ Statement of Vote (2006 Governor)
- ^ Statement of Vote (2006 Senator)
- ^ Statement of Vote (2008 President)
- ^ Statement of Vote (2010 Governor)
- ^ Statement of Vote (2010 Senator)
- ^ Statement of Vote (2012 President)
- ^ Statement of Vote (2012 Senator)
- ^ Statement of Vote (2014 Governor)
- ^ Statement of Vote (2016 President)
- ^ Statement of Vote (2016 Senator)
- ^ Statement of Vote (2018 Governor)
- ^ Statement of Vote (2018 Senator)
- ^ "Daily Kos Elections' presidential results by congressional district for 2020, 2016, and 2012".
- ^ "Our Campaigns - CA Governor - Recall Question Race - Sep 14, 2021".
- ^ "Counties by Congressional Districts for Governor" (PDF). sos.ca.gov. November 8, 2022. Retrieved May 4, 2023.
- ^ 1962 election results
- ^ 1964 election results
- ^ 1966 election results
- ^ 1968 election results
- ^ 1970 election results
- ^ 1972 election results
- ^ 1974 election results
- ^ 1976 election results
- ^ 1978 election results
- ^ 1980 election results
- ^ 1982 election results
- ^ 1984 election results
- ^ 1986 election results
- ^ 1988 election results
- ^ 1990 election results
- ^ 1992 election results
- ^ 1994 election results
- ^ 1996 election results
- ^ 1998 election results
- ^ 2000 election results
- ^ 2002 election results
- ^ 2004 election results
- ^ 2006 election results
- ^ 2008 election results
- ^ 2010 election results
- ^ 2011 special election results
- ^ 2012 election results
- ^ 2014 election results
- ^ 2016 election results
- ^ 2018 election results
